Transcript
Anyone who’s been a commercial or a design lead on a project, probably has a love hate relationship with spreadsheets, and especially that master spreadsheet – the one main spreadsheet tracking your commercial and technical issues, which exists in pretty much every project. Today I will be presenting our vision of how the technical and commercial details in a project can be managed, streamlined and automated without that spreadsheet.
Before we dive in, let me quickly introduce, Shapedo.
Shapedo is a design change management SAAS.
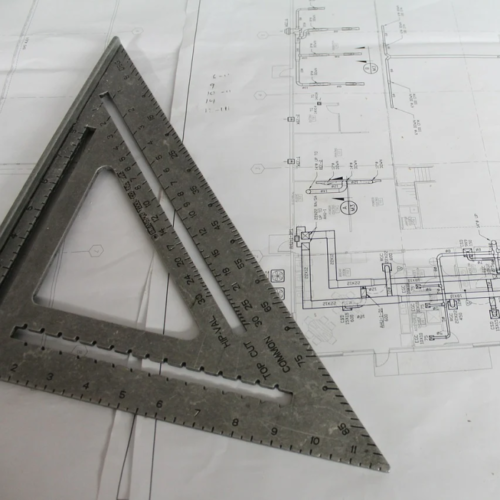
We developed a unique technology that compares between versions of drawings. So it’s like Track Changes in word, just for Drawings. And what that enables is for your teams to compare every new drawing and instantly identify all the things that have changed, even if designers did not mark or communicate them. Because these comparisons are near-instant, you can review dozens or even hundreds of updates each day. Now to anyone has spent Time manually reviewing drawings or paying the bill for changes on a project, I hope it’s clear how transformational that can be.
When we first introduced this we observed teams discovering hundreds of technical and commercial issues which were previously flying under the radar. But with no extra engineers and no or more hours in the day, they were often challenged to resolve all these additional issues. So even though they were discovered early, they didn’t have the resources to resolve them. What we learned very quickly is that it’s not enough to identify more issues, you also need to be able to solve them better and faster.
Around our drawing comparison and design development tool, We built a set of tools and processes to help manage the risks and implications. This includes communications, tasks, approvals, and also your formal notices, such as early warnings, compensation events, RFI;s, and etc. The most subtle, but perhaps the most important innovation is what brings all these things together. We call it power boards. Essentially, it’s a digital automatic streamlined version of your master spreadsheet, and what I’m going to be demonstrating today.
The agenda for today is both simple and short:
I’m going to remind you just how hard painful and risky it can be to run a project from a spreadsheet.
I’m going to show you how you can avoid that
The master spreadsheet.
I know a lot of people in software have a lot of problems with spreadsheets. But I actually think they’re the right tool for this challenge, and the master spreadsheet is a testament of a lot of what is good in construction.
The reason is in any project you have hundreds of things happening: you get changes from the client, you get changes from designers, you have issues with subcontractors, suddenly it rains for a week or you, or find nasty surprises on site. And you have all of these issues that need to be actively managed and the implications if you ever drop The ball even once are severe. You send an email late and it can cost you tens of thousands of pounds.
What great managers are able to do is to take all of these events happening on site and get them onto a single spreadsheet. These are the things that are happening. These are the implications. These are the actions we need to take. This is how we deal with it. And that is why in every successful project somewhere there’s this incredibly detailed spreadsheet, which is like a map of the whole projects project. Taking thousands of events and breaking them down into solution sized breaks.
You may ask yourself why hasn’t this been automated or streamlined or standardised? I think the requirements are actually quite high.
First, it needs to be detailed. It needs to be really detailed. You don’t need a dashboard or a snapshot. You need a detailed audit trail into specific status and progress of hundreds of complex engineering issues.
Second it needs to be really versatile. No two projects are the same. No two contracts are the same. Even within a project it needs to work differently for different packages and different stages.
Thirdly, it needs to be actionable. You don’t just need a log, you need to be able to cut and carve it to work how you need it. Your internal team needs one set of information, management needs a second set, and the client needs the third set of information.
The only tool available which is detailed, versatile and flexible enough is a spreadsheet.
But let us not forget it’s still just a massive spreadsheet, completely manually updated and not without its limitations:
First and foremost, errors are made. It’s all nice when you have 20 events, but when you have 700 events with five statuses across 26 packages – things get overlooked. Sometimes you just miss that email with the details. Sometimes you forget to update the spreadsheet after a meeting. Sometimes you literally copy the number into the wrong line. And I’ve seen six figure mistakes done literally by copying a number into the wrong line in the spreadsheet. Just for a bit of fun, there should be a poll coming up and to your right am and may tell if you can confirm when it comes up and asking, essentially, what is the largest single error and which is a result of a literally Excel mistake, and you’ve seen or experienced in your careers.
It’s not just that you are making mistakes, is incredibly time consuming to chase the overhead of this spreadsheet. I know too many great engineers, whose life revolves around updating a spreadsheet. You can easily spend Monday chasing quantity surveyors and design managers for final details. You prepare a report and sit a meeting for half of Tuesday. Wednesday you deal with what was decided, while thursday goes toworking on a management report. By Friday, you’re chasing your quantity surveyors again. Construction firms are paying some of the best managers in the industry six figures to chase the admin overhead of a spreadsheet.
Thirdly, if it’s not enough that you’re making mistakes and spending a lot of time, it’s a reporting nightmare. Your spreadsheet is built to action items in the project. Management care about different things, so you need to spend 2 days in each month preparing management reports. The client cares about different things, so you need to spend a day a week creating a client report.
Fourthly, the information is lagging. The information in the spreadsheet isn’t directly connected to what your Quantity Surveyors and Project Managers are agreeing with the client, the package managers and subcontractors, so there is a delay between the field and your spreadsheet. And if you have one of these must notify any issues within 14 (or 7, or 5) days you’re risking contractual entitlement.
Finally, you have this really colossal staff churn risk, because only one person really knows what’s going in the spreadsheet. How many projects do you know that were doing perfectly well, until they lost one key person and suddenly no one knows what’s going on in a spreadsheet?
Back to the story of ShapeDO: when we came up against this need to streamline and automate all these commercial and technical issues, we set out to build a digital equivalent.
Our leading question was how do we capture the essence of what a master spreadsheet is supposed to achieve, but we do it streamlined, automated, without all the costs, limitations, and friction. So what were the requirements?
It needs to be detailed. You need to track every single detail. You need to track any time there’s a change, anytime progress is made. And it needs to be up to a standard where it will stand up in court.
Secondly, it needs to be really versatile. It needs to be flexible because no two projects are alike. No two packages and situations even within a project are alike.
Thirdly, it needs to be actionable. We don’t want just an audit trail, which will only help in a dispute. The spreadsheet should be driving the project, you should be able to see the context you need. If you’re going into a meeting with the architect – you need to be able to have all the up and open architectural issues. If you are meeting with the main contractor or the client – you want to see what are all the unresolved commercial issues. Meeting with Management – see all the main liabilities.
It turns out that because we were already building forms and processes together with general contractors, project managers, and subcontractors, we can define and link the data so all of this happens automatically.
How does this look? When you begin a project you define the form and processes. You define your content – how does the RFI or change order or compensation event Look? What is in it? But you also define the process, the status’s, stages, deadlines. You’re also defining the filters and tags to make it actionable. So for each one of these forms, you’re asking: what package is it in? Is it impeding? Is it important? And any other question critical in your specific project. And then whenever the form is created, and subsequently whenever it’s changed or updated, it’s automatically reflected in the power board, which is the equivalent of what you’d think of as a master spreadsheet
So when a quantity surveyor creates a form – it is reflected in the
power board. The commercial director approves submitting the form – reflected in the powerboard. The status of an early warning changes – reflected in the Powerboard. You get an answer from the designers or the clients – reflected in the power board. You agree to commercial issues – reflected in the power board.
Because you set up all of these forms and processe, and you have filters on the data. We have the facility to connect these into project into project dashboards into enterprise dashboards and into client reports. So you get a golden thread of information, where whenever something is done, it’s updating automatically, accurately, in real time, all the places that matter for every context. So you have that perfect audit trail, but you also get insight that drives action and resolution of issues. A
I’m going to briefly demo this in ShapeDo. What I’m going to demonstrate is first, I’m going to go into the changes interface and show you a comparison. This is a good context to talk about a specific issue. Then I’m going to demonstrate the full process for creating, circulating and resolution of a technical issue in the simplest setup possible. So just a straightforward RFI, and how that looks across its life cycle. Finally, I’m going to discuss some more advanced ways you could use that in more complex or sophisticated processes.
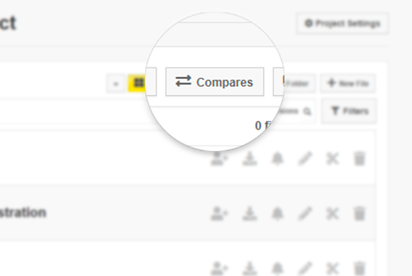
You are now seeing ShapeDo’s his interface. I’ve just navigated to a drawing folder. What you’re seeing over here is the progression of drawing versions. You would upload your drawings to here if you’re using shaped you as your primary document management system. If you’re using another document management system we could connect to that, and this will be automatically prepared for you. Between any two versions, I can compare, and this is the drawing comparisons we talked about.
What you are seeing is a red for subtracted blue for added, and then I can flick between the older and newer version.If I focus in on this door, you can see in the older version two doors that are fine, and in the new version, they change the direction of the swing and as a result, there’s a clash. We’re going to focus on this on an example of a technical issue.
So, if I received this, I might want to create an RFI. What I’m going to do is to choose the area of interest. I’ll take snapshots of the change, and those will be added to this RFI, for context. And already over here I can tag it, let’s say with the priority, the relevant package and the tag impeding. Now, if I were a junior person, I can perhaps save this as a draft and leave it for a decision maker to issue. In case of a consensus, I can semd it myself. Anyway, I can decide if I want to have reminders around that, and then send it. The RFI will go out as an email with attachment, and the reply to this email will be logged in the system.
So, I’ve identified an issue and I’ve sent an RFI. That’s all great. The real magic happens when I now go into my RFI PowerBoard. Here you have a list of all of the RFIs in this project. I can click into a RFI and see the full context, any discussions or answers I’ve received, when it was sent, when it was closed, and how long it took to resolve.
In addition, I can use the filters, as I’ve used them when issuing an RFI, and that’s more context for me.
For example, I’m going for a meeting with an architect, I can choose the relevant packages. And I can choose the ones that are still open and and print this out. And that becomes the agenda for the meeting.
If I’m writing a early warning to the client, noting that we’re having technical issues by designers. What I can do, is look at all the impeding issues in the project, print those out and ask to solve the issues urgently.
If I’m having an internal design meeting, perhaps I’ll look at the high priorities for a specific package. This again gives me context.
From there, this comes into a dashboard. The dashboard is set up to track the KPIs of the project. How many issues are we successfully resolving? You can track the whole project, the progress from month to month. You can see how many RFIs are still open after 28 days, between 14 and 28 days, and less than 14 days. I can see how the project improved from month to month. Similarly, I could have the same details per package or per designer.
In enterprise reports, I see all across multiple projects. When you add all together, it creates a powerful ability to track and resolve issues. Now, I followed a design issue, but you could have a similar path with commercial issues. For example, I am a main contractor, I can use this for the client accounts. And I can have a similar form and process for subcontractor accounts. And I can compare and contrast my subcontractor accounts with my client accounts so that I can see where my
exposures are commercially in the project, and where the higher urgency and where the priority is.
When you add all of this together, instead of having two issues created in a massive Express Excel spreadsheet, the issues are connected to the PowerBoards and dashboards, and are fully actionable.
I want to discuss a case study, very briefly. A 225 million pound project issued over 500 RFIs. Using ShapeDo system, they are able to achieve 96% successfully resolved RFIs. Now, on a live project, that basically means they are successfully resolving all the technical issues in the project. I don’t know, anyone, anywhere that has achieved that sort of performance level. Now, that’s not done by software. That’s done by excellent management and a collaborative environment, enabled by software.
To summarize, ShapeDo saves a biblical amount of time. The spreadsheet overhead, with the time of the reporting and the time of collecting it. It’s the time of us as MPs and DMS, sending the information and to the commercial and technical leads. The important thing is not cutting down on technical lead costs, but giving more hours in a day to the most important people in the project.If the commercial lead now has another 2 or 3 or 4 hours every day, these hours are spent better resolving the main issues in the project.
Second of all, you’re getting improved performance, as you’re doing better tracking and resolution of issues. You’re balancing your books better, you’re reporting to the clients, communicating with the service supply chain, and all of this in a much more streamlined, efficient way
Finally, as a result of all of this, you’re getting a massive mitigation of risk. Errors and risks happen because things don’t get tracked. If I look back to the poll we did, I can see that, you know, our audience saw errors costing 10-100 millions of pounds. That’s a big risk you can mitigate but knowing what’s going on in the project.